01Problem
Irrigation and swamp canal networks in South Sumatra run for thousands of kilometres, and conventional re-surveys are too slow and expensive to repeat. How much usable terrain can one consumer-drone flight and open models give you — and where does it stop being trustworthy?
Three rounds of experiments on a single flight: 36 photos, of which 22 nadir frames with only about 46% forward overlap. Everything ran on CPU.
02What I did
- Dense matching and georeferencing (August). MASt3R matched all 70 candidate image pairs. A similarity fit to the drone's GNSS gave 0.93 m horizontal but 3.59 m vertical RMSE, with a bowl-shaped drift along the strips. Adding the barometer as a soft constraint cut vertical RMSE to 1.44 m (−60%).
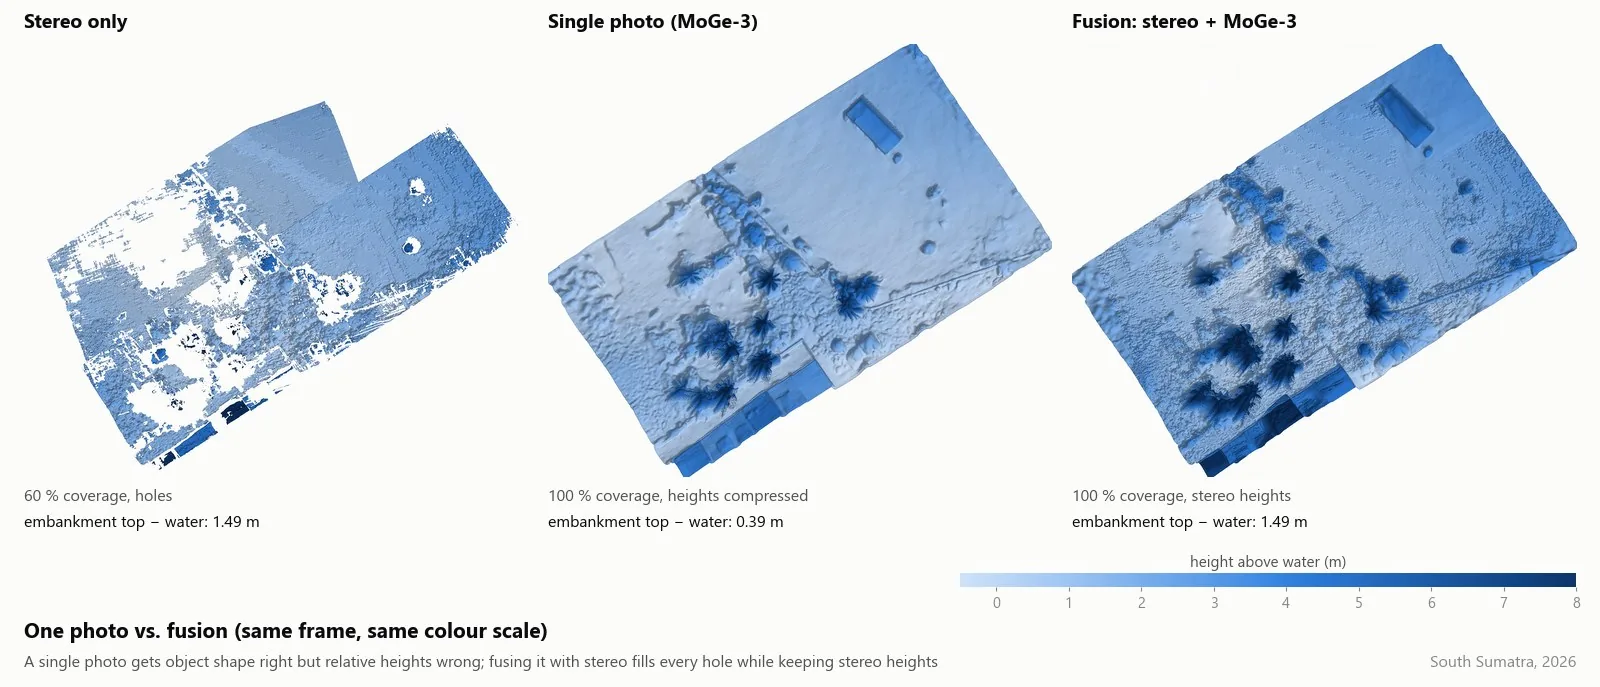
- One photo versus stereo (September). Monocular depth from MoGe-3 draws objects sharply, and on open ground it stayed within 0.27 m RMSE of calibrated stereo — but it got height differences badly wrong: an embankment 1.46 m above the swamp water came out at 0.41 m. Verdict: a sketch of shape, not elevations. (To run the model's refiner without an NVIDIA GPU, three sparse 3D operations were rewritten in plain PyTorch and checked against the dense equivalent.)
- Fusing both. Stereo is kept wherever it exists; MoGe-3, calibrated to the surrounding stereo, fills the gaps. On one frame the surface became 100% complete and the embankment height matched stereo (1.49 m). In hold-out tests — hiding blocks of stereo and filling them — the fused error was 0.20 / 0.38 / 0.45 m for 2 / 6 / 15 m gaps, against 0.62 / 0.96 / 0.81 m for interpolation. Applied to all 22 frames: a 5.32 ha mosaic at 10 cm cells with 0.5 m contours, and the median height bias between overlapping frames on flat ground reduced from 1.48 m to 0.17 m.
03How it works
MoGe-3 alonestereo interpolationfusion
| Hidden gap | Model alone | Stereo interpolation | Fusion | Fusion, open ground |
|---|---|---|---|---|
| 2 m | 0.80 m | 0.62 m | 0.20 m | 0.05 m |
| 6 m | 0.81 m | 0.96 m | 0.38 m | 0.08 m |
| 15 m | 0.64 m | 0.81 m | 0.45 m | 0.20 m |
04Limits
What the results are not. No ground control points and no RTK were used. Seams between frames still show at about ±0.5 m, the large-scale shape of the mosaic is unverified, and the contours are indicative (about ±1–1.5 m). The limits now sit in camera orientation — a rolling shutter and 34–46% overlap — so the next step is a re-flight with at least 75% forward and 65% side overlap and five or more ground control points. That is exactly the missing component of the low-cost survey concept on the research page (DIY RTK for ground control).
05Stack
- Python
- PyTorch
- MASt3R
- MoGe-3
- OpenCV (SIFT, RANSAC, SGBM)
- NumPy / SciPy
- pyproj
- shapely
- ezdxf
06Gallery
Raw drone photos and the orthophoto are not published: they show a residential area. The comparison image comes from the fusion round, where the embankment measured 1.49 m (stereo and fusion) and 0.39 m (single photo); the 1.46 m and 0.41 m quoted above come from the earlier one-photo round with a three-photo stereo reference.